How Does Austin-Area MLS Inventory Compare to Last Year?
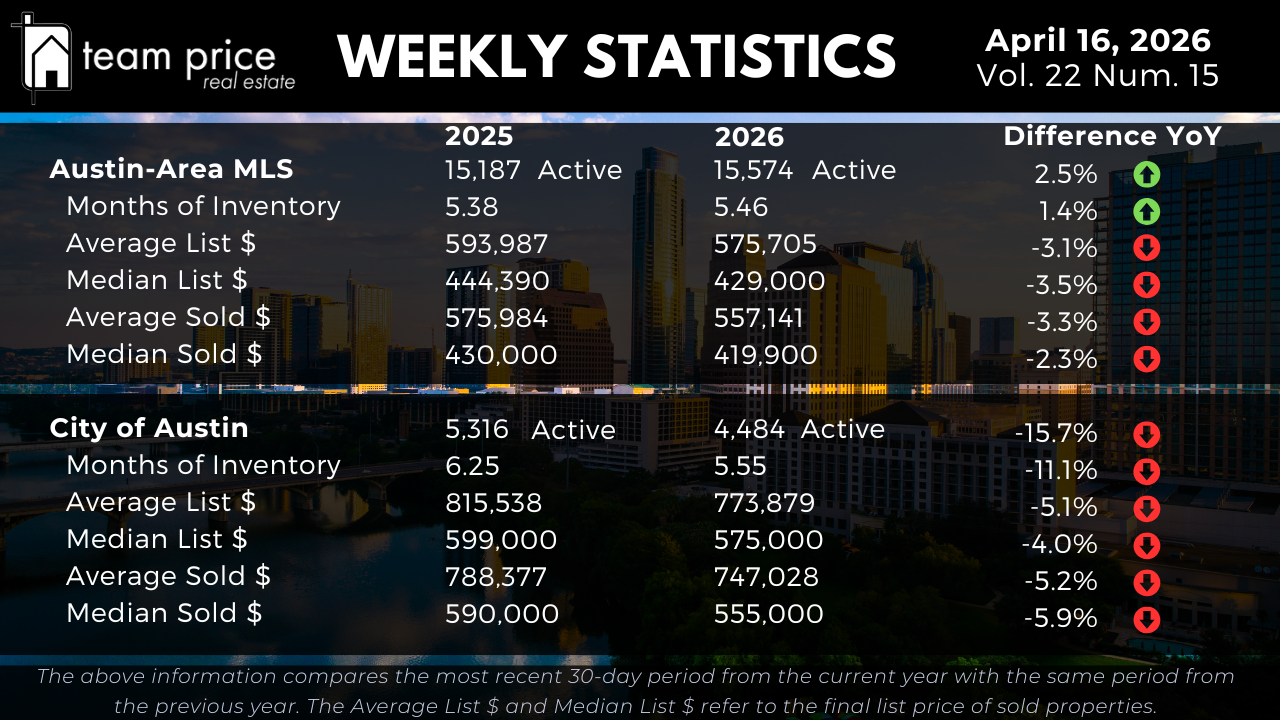
Active listings across the Greater Austin MLS reached 15,574 this week, up 2.5% from 15,187 at this time last year. Months of supply is 5.46, a 1.4% increase from 5.38 twelve months ago. The MLS-wide inventory story is one of gradual accumulation, not a sudden flood. Supply is building, but it is doing so at a measured pace.
The City of Austin is the counterpoint. Inventory there fell from 5,316 to 4,484 active listings, a 15.7% year-over-year decline. Months of supply improved from 6.25 to 5.55, an 11.1% reduction. The city is absorbing homes at a better rate with fewer listings competing for buyers. That is a healthier structural condition than the headline price numbers alone would suggest.
What Are Homes Selling for in the Austin-Area MLS Right Now?
Across the Austin-Area MLS, the average active list price is $575,705, down 3.1% from $593,987 a year ago. The median active list price is $429,000, down 3.5% from $444,390. Sellers have already repriced. The question is whether closed values are catching up to current ask prices or continuing to trail them.
On the sold side, the average sold price is $557,141, down 3.3% from $575,984. The median sold price is $419,900, down 2.3% from $430,000. The sold-to-list ratio is sitting at 97.65%, meaning the typical home is closing within 2.35% of its final list price. That is a narrow spread, and it tells you that sellers who price accurately are transacting cleanly.
What Are Home Prices Doing in the City of Austin?
Inside Austin city limits, the repricing is more pronounced. The average active list price is $773,879, down 5.1% from $815,538. The median active list price is $575,000, down 4.0% from $599,000. Sellers inside the city have taken meaningful ground off their ask prices over the past twelve months.
Closed prices have followed. The average sold price is $747,028, down 5.2% from $788,377. The median sold price is $555,000, down 5.9% from $590,000. A buyer purchasing at the median inside Austin today is paying $35,000 less than a buyer at the same point last year. That is a real dollar shift, not a rounding difference.
Are Buyers Getting Deals Below List Price in Austin?
The negotiation data this week shows a market in transition. So far this month, 62.06% of all Austin-Area MLS closings came in under list price, down from 65.18% last month. That directional shift matters. Fewer homes are closing below ask, which suggests sellers are either pricing tighter from the start or buyers are encountering more competition on well-priced properties.
At the same time, 16.76% of homes closed above list price this month, up from 13.14% last month and above the 15.37% recorded in April 2025. Above-list closings rising year over year while the overall market softens is the signature of a bifurcated market. Accurately priced, well-presented homes are drawing multiple offers. Everything else is negotiating. The 21.18% of closings landing exactly at list price, down slightly from 21.68% last month, rounds out a picture of a market where pricing precision determines outcome more than any other single variable.
Which Austin-Area Cities and ZIP Codes Are Seeing Price Increases?
Across the 30 tracked cities in Central Texas, 11 posted a month-over-month price increase and 18 posted a month-over-month decrease. Year over year, 10 cities are showing price increases and 20 are showing declines. Only 2 of the 30 tracked cities are currently trading above their 12-month price peak. The other 28 remain below where they were at their highest point in the past year.
The ZIP code picture tells a similar story with slightly more nuance. Of the 75 tracked ZIP codes, 33 posted a month-over-month price increase and 41 posted a decrease. Year over year, 33 ZIP codes are up and 42 are down. Only 1 of the 75 tracked ZIP codes is currently above its 12-month price peak. The other 74 are trading below it. The breadth of softness across Central Texas is notable. This is not a story contained to one submarket.
How Far Have Austin Home Prices Fallen From Their Peak?
Across the Austin-Area MLS, every major price metric remains well off its peak. The average list price peaked at $708,929 in March 2023 and sits today at $676,723, a decline of $32,206 or 4.5%. The median list price peaked at $539,900 in May 2022 and is now $471,595, down $68,305 or 12.7%. The average sold price peaked at $664,515 in May 2022 and currently stands at $566,120, a drop of $98,395 or 14.8%. The median sold price peaked at $538,000 in May 2022 and is now $429,843, a decline of $108,157 or 20.1%.
Per-square-foot values reinforce the picture. The average sold price per square foot peaked at $324 in April 2022 and is now $259, down $65 or 20.1%. The median sold price per square foot peaked at $280 in April 2022 and is now $214, down $66 or 23.6%.
Inside the City of Austin, the peak declines are deeper. The average list price peaked at $958,113 in September 2025 and is now $844,844, a drop of $113,269 or 11.8%. The median list price peaked at $658,589 in May 2022 and is now $579,900, down $78,689 or 11.9%. The average sold price peaked at $847,583 in May 2022 and is now $710,001, a decline of $137,582 or 16.2%. The median sold price peaked at $680,000 in May 2022 and currently sits at $550,000, a drop of $130,000 or 19.1%.
On per-square-foot values for the City of Austin, the average peaked at $442 in May 2022 and is now $345, down $97 or 21.9%. The median sold price per square foot is reported at $214 currently. Note: the source data states the drop from peak as $90 from a peak of $393, which would produce a current value of $303. The figure of $214 does not reconcile with a $90 drop from $393. The actual decline from $393 to $214 is $179 or 45.5%. This discrepancy has been flagged and should be verified against the source PDF before publishing.
What Is the Austin Real Estate Market Outlook for Spring 2026?
The data this week is pointing in two directions at once, and that is actually useful information. Lagging indicators, closed prices, are still declining across both the MLS and the City of Austin. Leading indicators, above-list closings rising month over month and year over year, inventory improving in the city, and absorption holding steady, are quietly signaling that the bottom of this correction may be forming.
That does not mean prices are about to reverse sharply higher. Twenty-eight of 30 tracked cities and 74 of 75 ZIP codes are still below their 12-month price peaks. The correction has been broad and persistent. But the mechanics of a floor are present. Supply in the city is contracting. Buyers are showing up and in some cases competing. The closed prices recording today were negotiated weeks ago. What buyers and sellers are agreeing to right now will be the story in next month's data. Spring is historically the highest-activity season in Central Texas real estate. If the leading indicators hold, the gap between what the lagging data shows and what the market is actually doing will narrow over the next 60 to 90 days.